
 February 4, 2013
Operations Manager 2012 SP1 enables in-production, always-on root-cause monitoring and analysis of .NET Applications. AVIcode Intercept 5.7 functionality was shipped in the SCOM 2012 RTM last year.
What can I expect from application monitoring
- Efficient troubleshooting of issues related to .NET based applications in all of your environments (QA, Stage, Pre-Prod and Production)
- Able to perform Server-Side and Client-Side Monitoring of your Applications
- Provide root-cause diagnostic information to your developers
- Support QA documenting application defects (bugs) and performance issues
- Integration with Team Foundation Server 2010/2012
- People and tools are crucial to avoiding disaster
Monitoring your .NET applications with SCOM 2012 is extremely easy and I definitely recommend doing so if you can, your operations team will thank you for making their lives easier supporting your application on their infrastructure. TFS CALs are not required to access Team Foundation Server using Microsoft System Center Operations Manager. This enables any of your operations staff to take operational issues encountered in production and raise them as issues to the development/engineering team, automatically creating a work item in Team Foundation Server.

Check on the health of your applications

View application performance
New Monitoring Capabilities in SCOM 2012 SP1
- Monitoring Windows Services Built on the .NET Framework (present in AVIcode, this is now possible again)
- Automatic Discovery of ASP.NET MVC3 and MVC4 Applications (System.Web.Mvc.dll is found in the /bin folder)
- New Transaction Types: MVC Pages and WCF Methods (Allows for more detailed settings for an application)
- Monitoring SharePoint 2010 Applications (Client-side .NET Application Performance Monitoring (APM) is not supported for SharePoint)
- Global Service Monitor – uses Windows Azure – Reports on availability, performance and function of web applications by scheduling and executing synthetic transactions (uses Visual Studio .webtests)
What’s new in SCOM 2012 SP1 for TFS 2010/2012
- Shipped as part of Operations Manager, included in the SP1 Media
- Improved security – synchronization account no longer requires TFS administrative rights
- Improved design of the Operational Issue WITD (Work Item Type Definition)
- Improved design of the configuration Wizard
- Introduced support for TFS Area Path
- Support for default Team Projects
- Synchronization for new APM alert types from IIS 8.0 web applications, WCF, Windows Services, and also for non-APM alerts
- Localization of Wizard UI and MP elements, and compatibility with localized versions of TFS
- Synchronize file attachments that can reside on a network file share or appended to TFS work items
- Automatically route and close alerts to TFS
- IT operations can open TFS work items directly from the Operations Manager console using built-in integration with TFS web UI
SCOM 2012 meet TFS 2010/2012
Sending operational issues from SCOM to TFS is incredibly easy. Once the relationship is configured in SCOM 2012 in the management console (under TFS Work Item Synchronization).

TFS Work Item Synchronization
When an “Operational Issue” presents itself in the management console it can be “Assigned to Engineering” which effectively forwards it to TFS. A special work item type “Operational Issue” was created in the Team Project during the TFS Work Item Synchronization configuration for this purpose.

Assigned To Engineering
Once in TFS the development/engineering team can “Acknowledge” the incident and then proceed to work on a resolution.
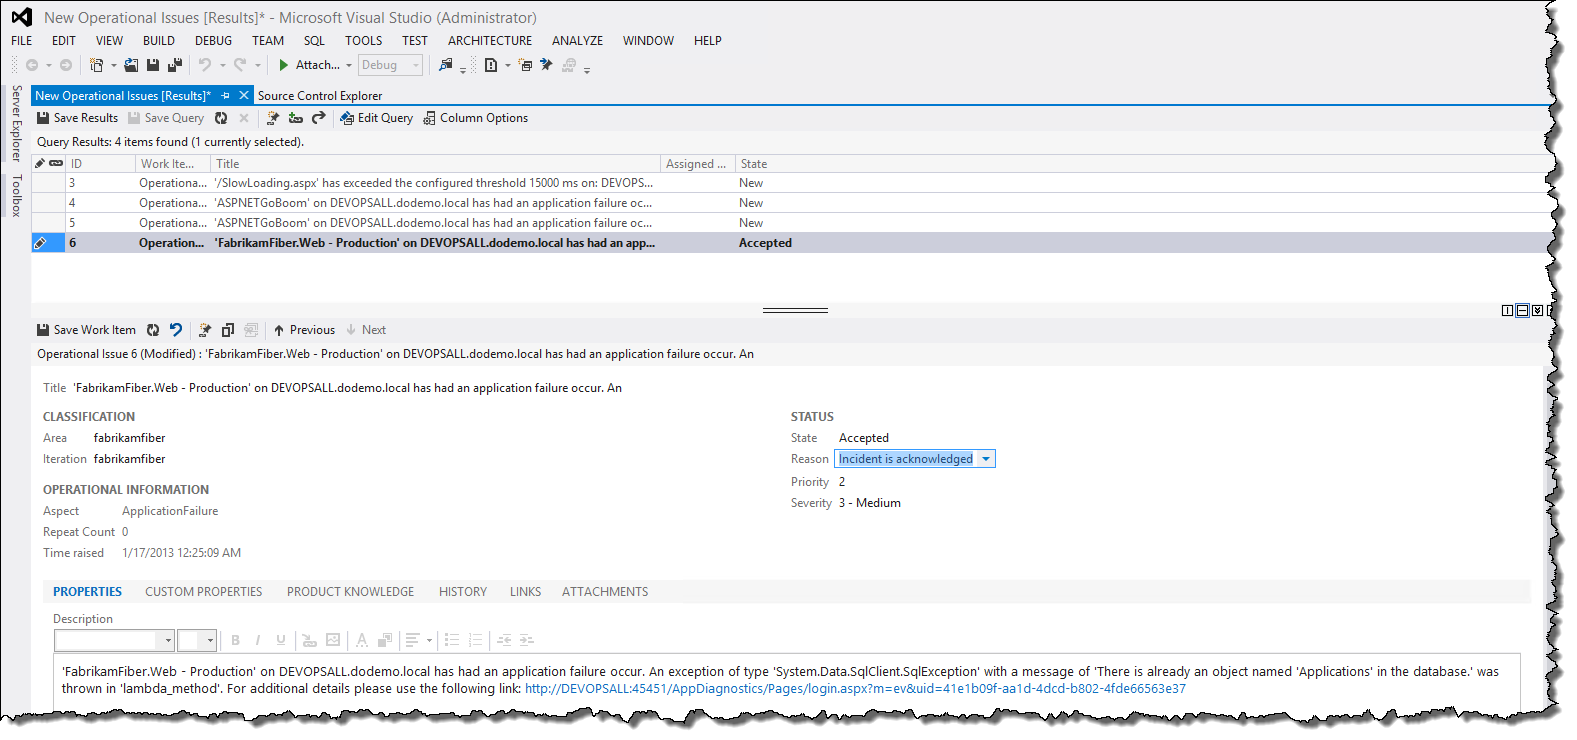
Accept and Acknowledge Incident
The operations team current status of the issue is updated to reflect that it has been acknowledged.

Operations Acknowledged
Conversion of APM events to IntelliTrace format
Allows for opening of APM exception events from Visual Studio as if the exception was captured during an IntelliTrace historical debugging session.
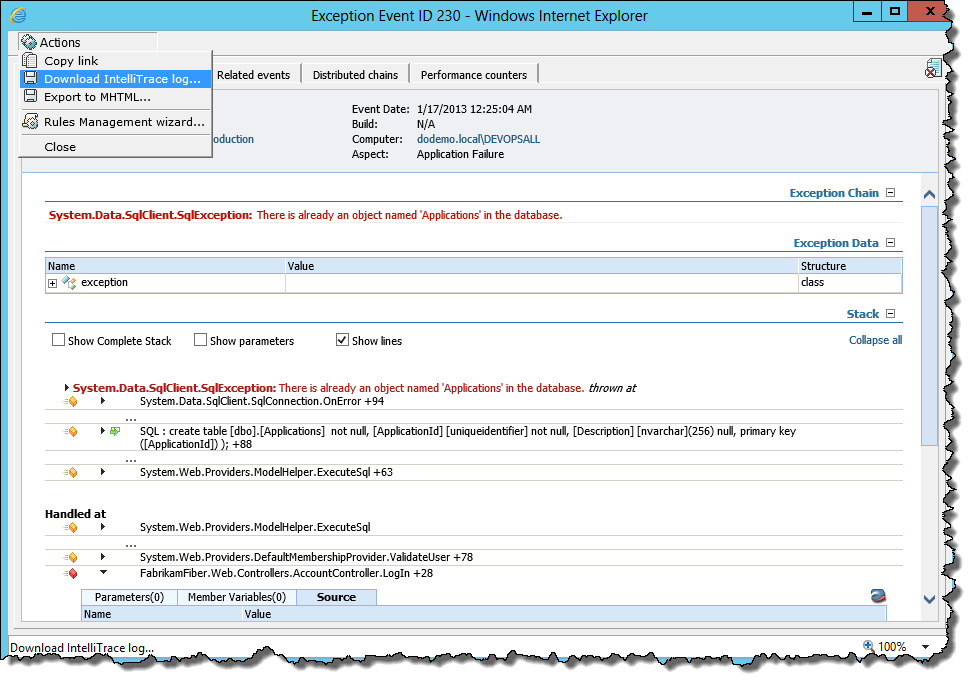
Download Intellitrace Capture
Features
- APM exception events can be saved in IntelliTrace file format directly from Application Diagnostics Window
- Traces are automatically attached to APM exception events and can be automatically added to TFS work items
- Developers can open traces using Visual Studio 2012 Ultimate Update 1
IntelliTrace Profiling Management Pack
Easily capture traces directly from the Operations Manager console, the management pack automatically deploys the IntelliTrace Collector to the designated servers.

Start IntelliTrace Collection
So much cool stuff in this release!
.NET Application Performance Monitoring
The Applications you are monitoring are shown below in the Operations Manager console under Authoring | Management Pack Template | .NET Application Performance Monitoring
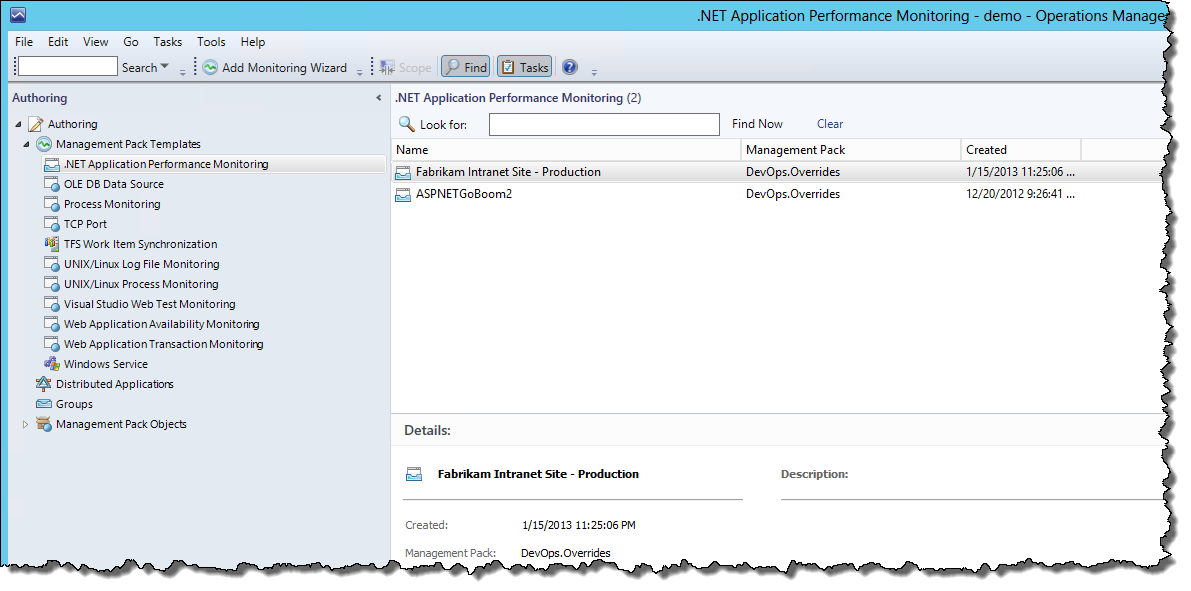
Application Performance Monitoring
You are able to specify the components of your application you wish to monitor by selecting them in the following dialog, this also includes settings for server-side and client-side monitoring.
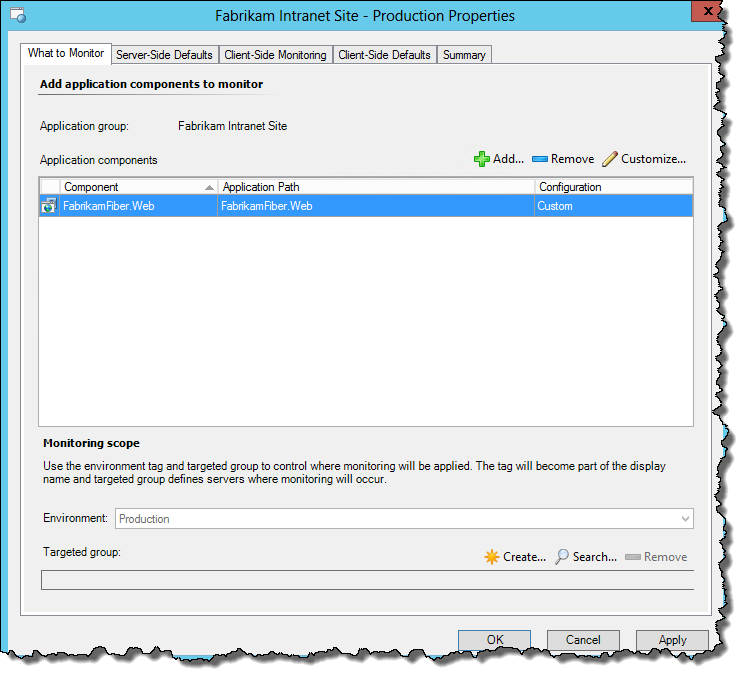
Application Monitoring Properties
You can see from the settings below you are able to enable “Performance Event Alerts” and “Exception Event Alerts”.

Application Monitoring Server-Side Defaults
If you venture into the “Advanced Settings” you will see you can configure the sensitivity threshold as well as specify the exception events you want to monitor:
- Security alerts
- Connectivity alerts
- Application failure alerts
You can also specify whether you want to monitor “All exceptions” or “Critical exceptions only”.

Application Monitoring – Server-Side Defaults – Advanced Settings
If you have any questions feel free to leave me a comment. I recently delivered some presentations on this particular topic in Montreal and Ottawa and you can access my PowerPoint deck here.
If you are interested in finding out more about System Center 2012 SP1 here are some links you might find useful:

Trackbacks/Pingbacks
[…] Welcome to the New Age | SCOM 2012 SP1 and TFS 2010/2012 (DevOps) […]
LikeLike